
Page 53 - Year 9
P. 53
Collecting and analysing data Sets 1 and 2 Maths: 1 of 7 Collecting and analysing data Sets 1 and 2 Maths: 2 of 7
Mean Add up the values and divide by how The mean of 3, 4, 7, 6, 0, 4, 6 is Find the mean of:
many values there are. Averages from Grouped Data
3 + 4 + 7 + 6 + 0 + 4 + 6 7, 8, 5, 12 All the examples on this
= 5
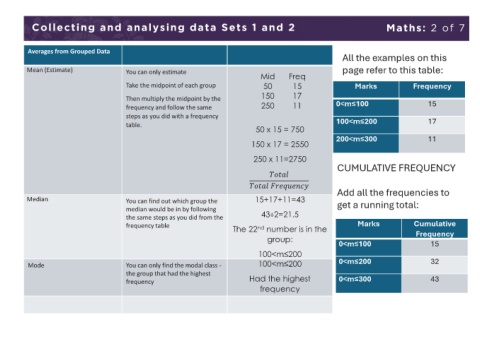
7 Mean (Estimate) You can only estimate page refer to this table:
Median Value The middle value. Find the median of: Find the median of: Mid Freq
Take the midpoint of each group 50 15 Marks Frequency
Put the data in order and find the 4, 5, 2, 3, 6, 7,6 a)12, 12, 11, 10, 14 150 17
middle one. Then multiply the midpoint by the
Ordered: 2, 3, 4, 5, 6, 6, 7 frequency and follow the same 250 11 0<m≤100 15
If there are two middle values, find the Median = 5 b)12, 12, 11, 10, 14, 10 steps as you did with a frequency
number half way between them by table. 100<m≤200 17
adding them together and dividing by 50 x 15 = 750
2. 200<m≤300 11
Mode / Most frequent/common. Find the mode: Find the mode: 150 x 17 = 2550
Modal Value There can be more than one mode 4, 5, 2, 3, 6, 4, 7, 8, 4 a) 1, 1, 2 250 x 11=2750
(called bi-modal or multi-modal) or no Mode = 4 Mode: CUMULATIVE FREQUENCY
mode (if all values appear once)
a) 1, 1, 2, 2, 3 Add all the frequencies to
Mode: Median You can find out which group the 15+17+11=43 get a running total:
Range The difference between the highest and Find the range: Find the range: median would be in by following 43÷2=21.5
lowest vales the same steps as you did from the
3, 31, 26, 102, 37, 97 frequency table Marks Cumulative
nd
Range is a ‘measure of spread’. The The 22 number is in the Frequency
smaller the range the more consistent a) 1, 2, 3, 4 group: 0<m≤100 15
the data. Range = 102-3 = 99 Range:
Frequency Table A record of how often each value in a 4, 4, 5, 5, 6, 6, 6, 6, 7, 7, 7, 7, 7 becomes: 3, 3, 3, 3, 4, 4, 4, 5, 5 becomes 100<m≤200 0<m≤200 32
set of data occurs. Mark Tally F Mode You can only find the modal class - 100<m≤200
the group that had the highest
They can be made by using a tally. 3 frequency Had the highest 0<m≤300 43
4 frequency
5